Emburse Analytics Research
This project demonstrated my ability to summarize complex accounting user flows and how I use my research to navigate product strategy.
Understand the product and business needs
What is Emburse Analytics?
Emburse Analytics acts as an enhancement services to Emburse’s core expense management tools ChromeRiver and Certify. It is a comprehensive reporting and analytics platform designed to provide businesses with deep insights into their expense data.
Why does the company seek to upsell the Emburse Analytics service?
Emburse Analytics is a crucial component of our expense management ecosystem. To enhance our value proposition and build competitive advantage, the company has decided to focus on better understanding current user behaviors and increasing efforts to promote Pro upgrades.

Enterprise Analytics Software
Tie my research to business vision
In 2022, Emburse aimed to migrate the Emburse Analytics service from a third-party integration to its own platform. The product team wanted to gather initial feedback as we’ve heard personal complains from our client mentioning “difficult to navigate for accessing data files.”
As a business-to-business software company, we took our clients' feedback to heart and promptly initiated research to fully understand the end-to-end product flow.
Before diving into the research, I dedicated an entire week to navigating the platform, building analytics reports and dashboards, and familiarizing myself with the product and its business models.
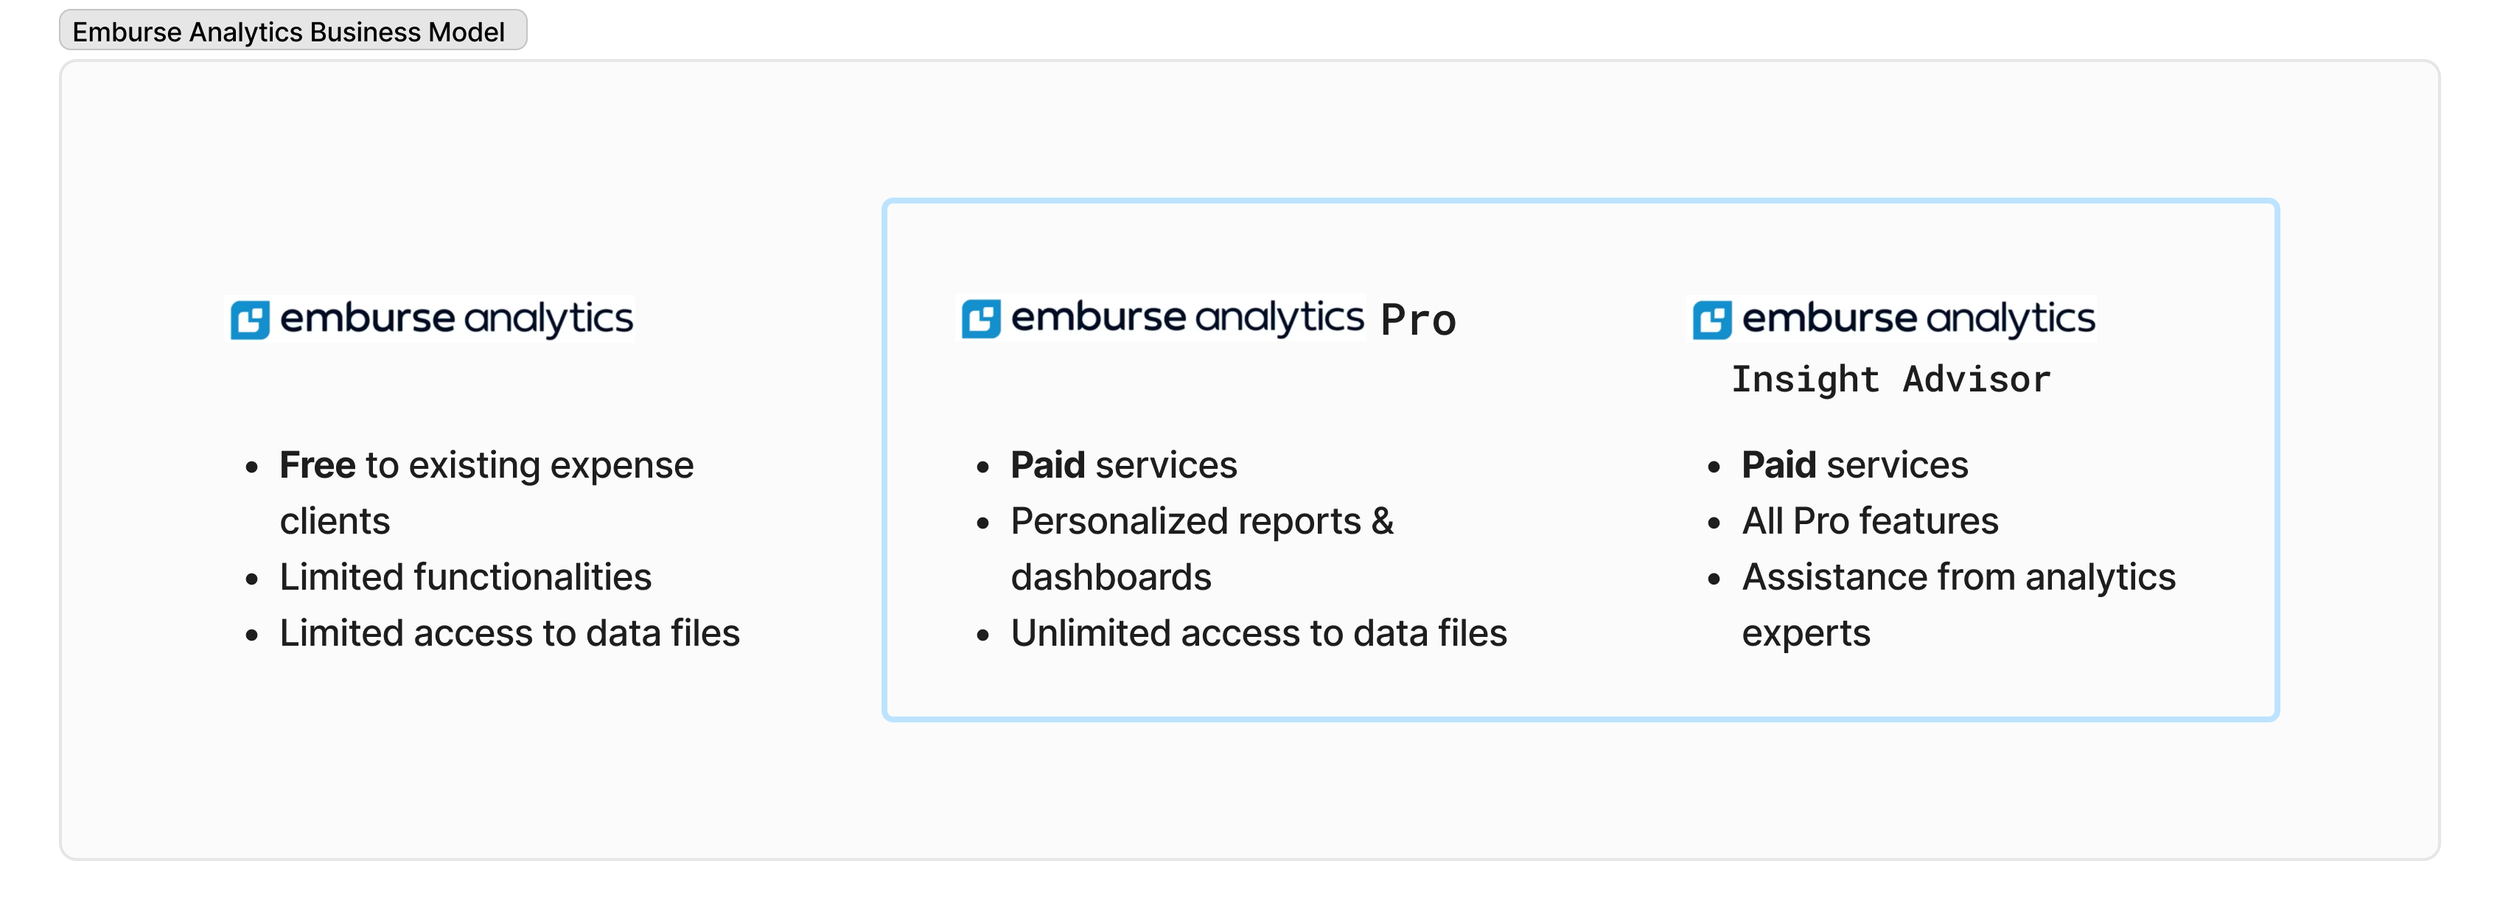
3 types of services are offered to our clients. Our business goal is to promote pro upgrades (highlighted section) to increase revenue.
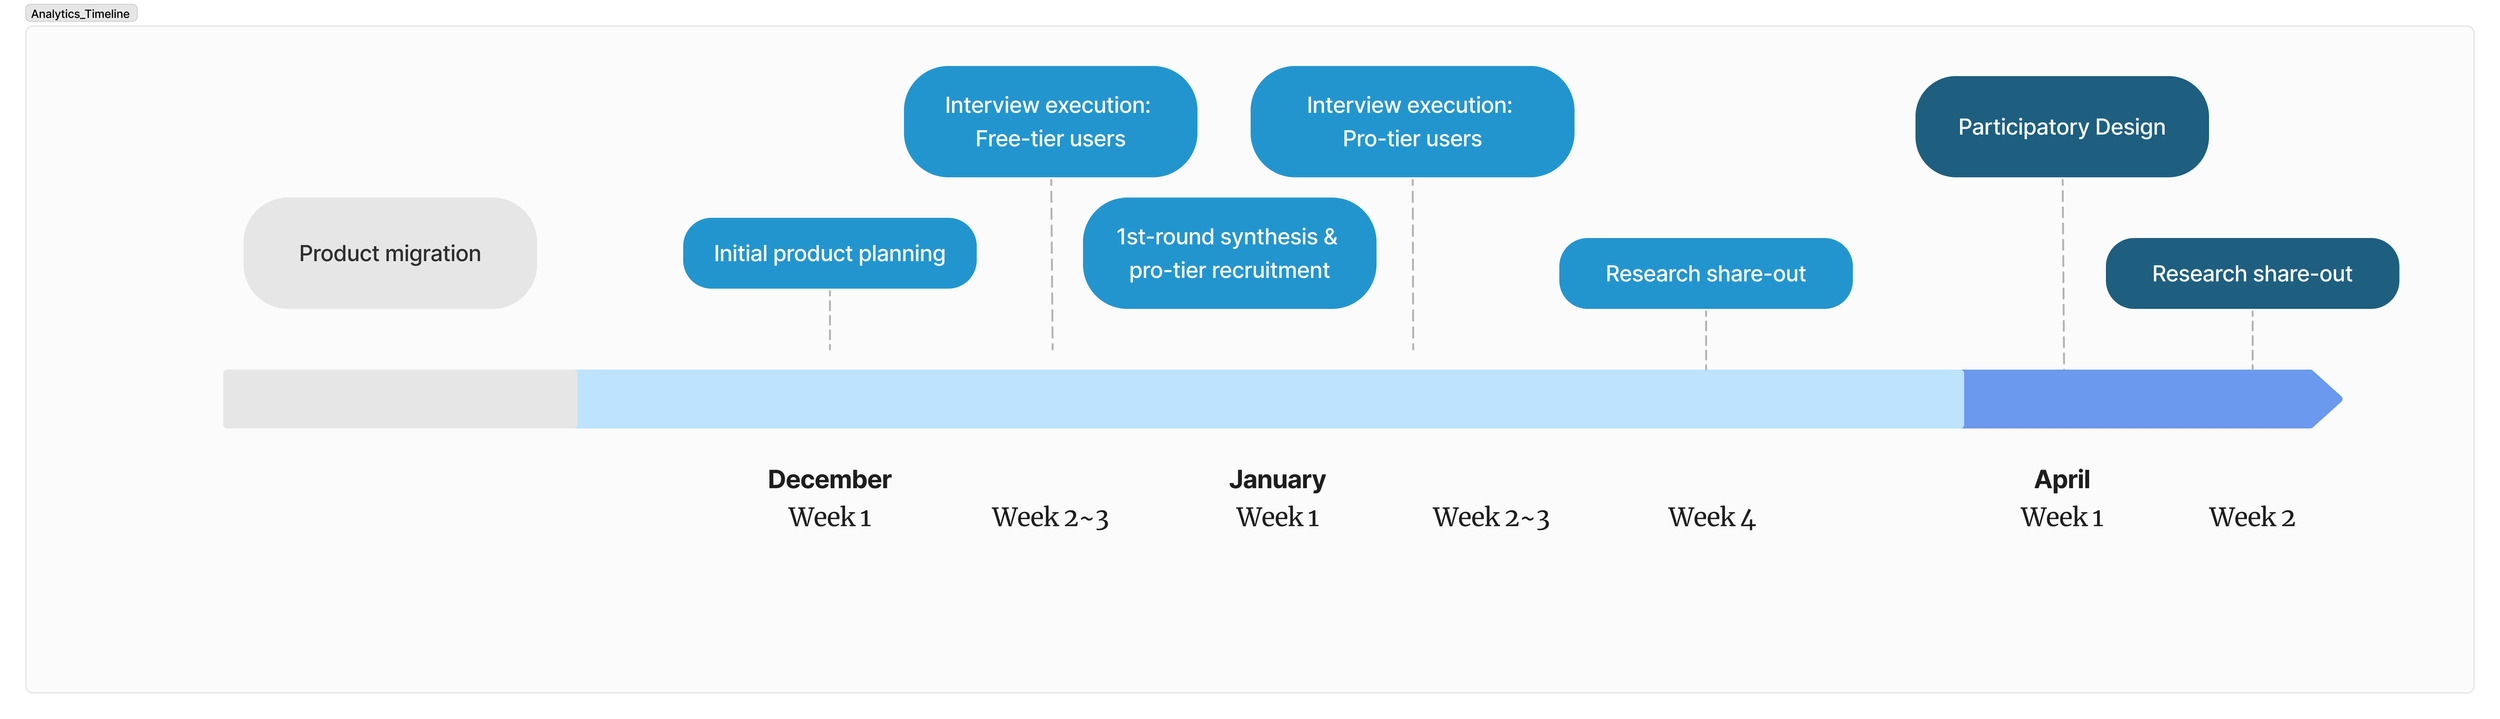
Project timeline
Team: Analytics Designer, Analytics Engineer Head, VP of product
Research Planning
Research goals
1. Explore general users’ intentions when using Emburse Analytics
2. Differentiate between user behaviors in the free-tier and pro-tier groups and understand their respective value propositions
3. Specify pain points within the current information architecture & look for improvements
Select target audiences
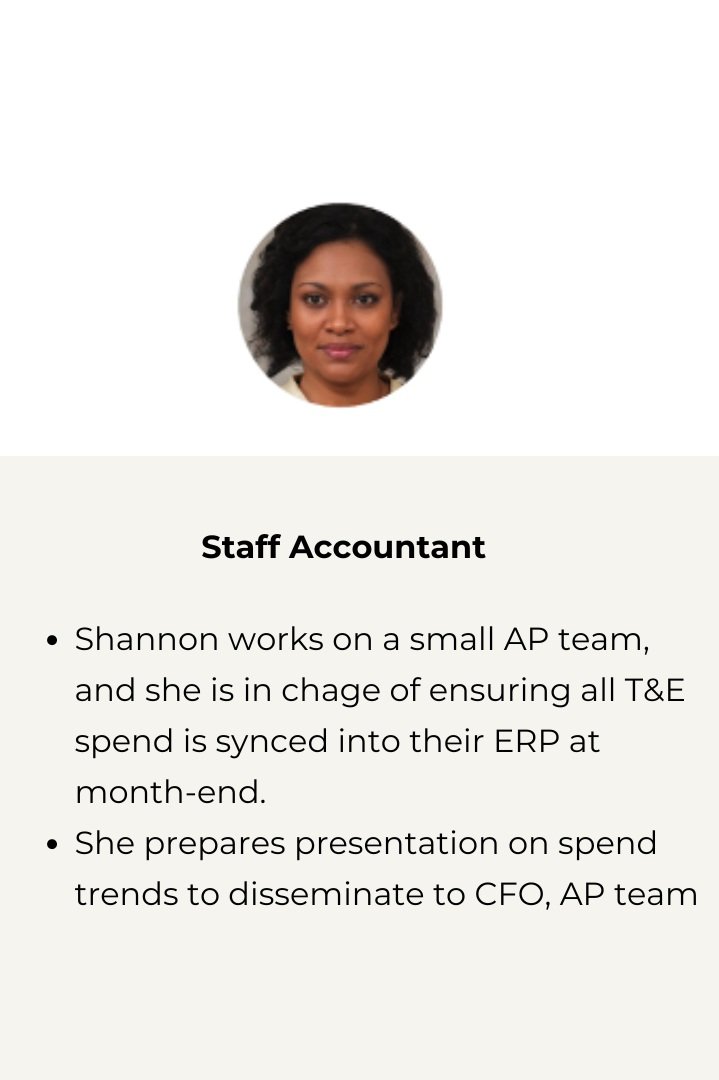
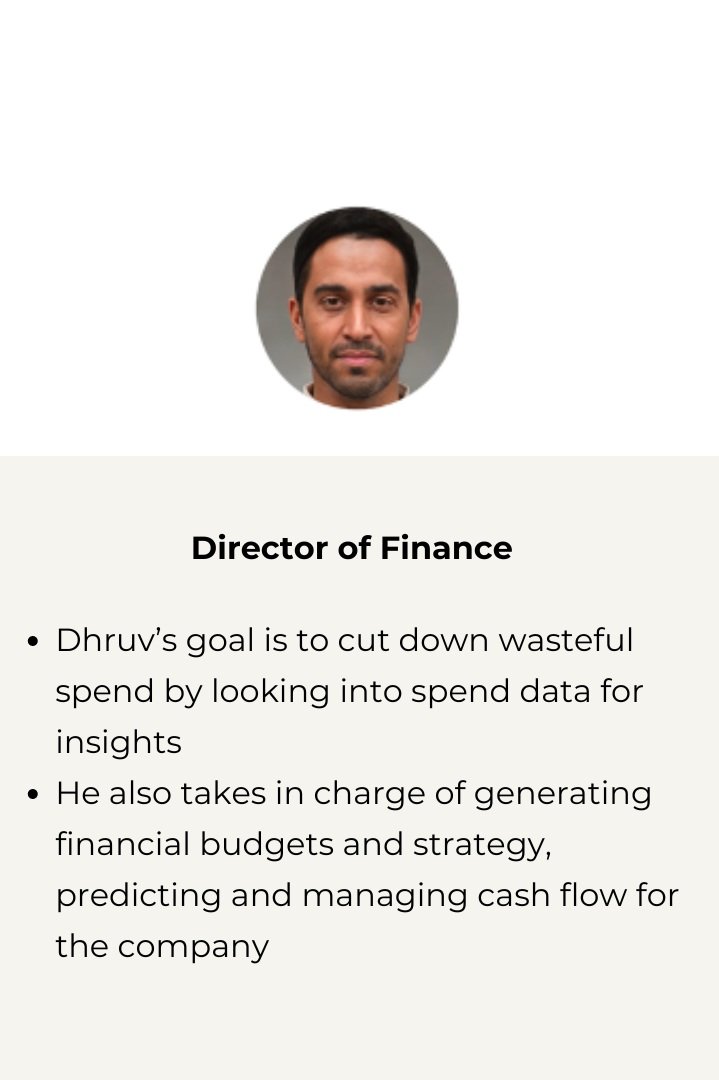
We are looking for clients who are actively use spend data and insights to inform their financial strategy. Thus, we reached out to financial admins/accountants/business analysts who would be the target users of our emburse analytics tool.
Testing metrics
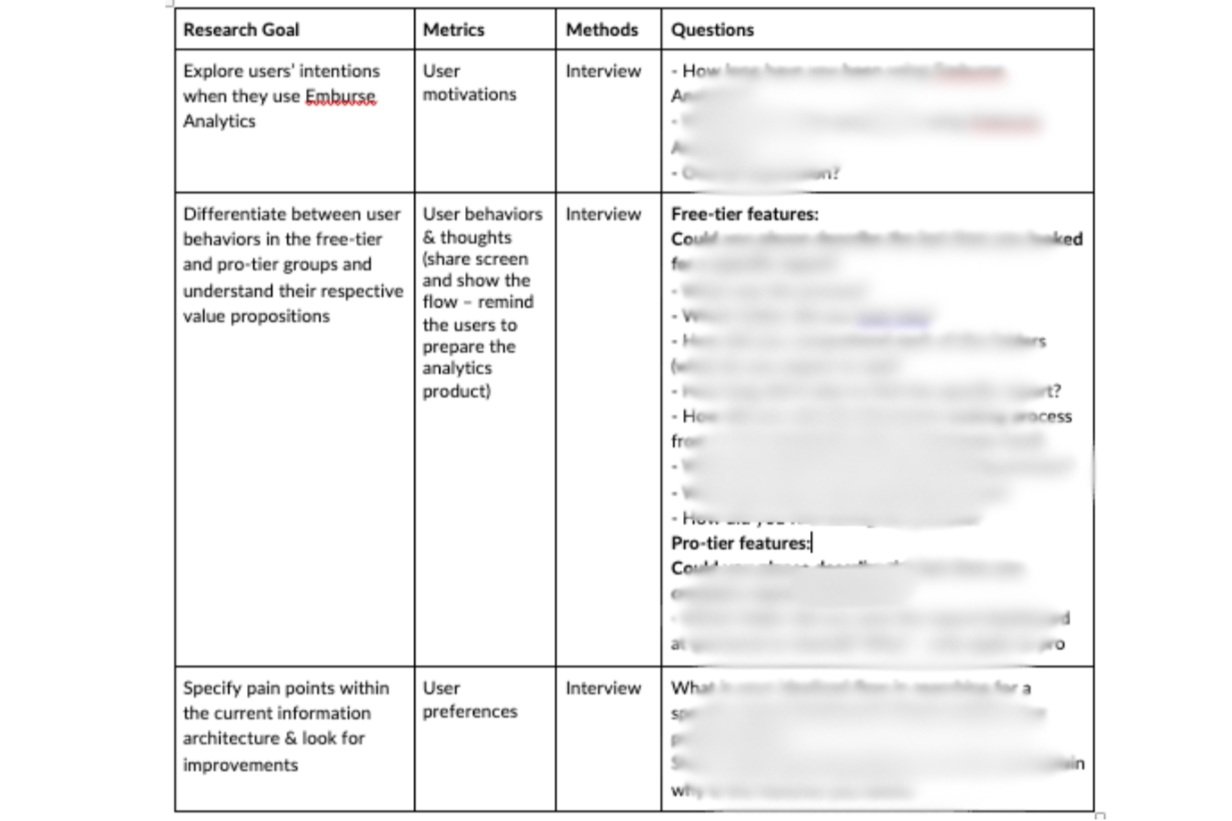
With the overarching goal in mind, I started looking into product features, analyze user flow step by step, and think aloud over the metrics I would like to gather. Here I was aligning research goals with the metrics I wished to gather, along with methods, and interview scripts.
Methods
In-depth Interview
n = 12
Understanding of user motivation with a persona outline
Before analyzing the specific user flows, I felt it was crucial to understand users’ motivations for using analytics tools. This would not only provide me with a fundamental understanding of why users utilize our service, but also highlight the importance of analytics tools within the enterprise spend control ecosystem.
Actionable insights leading to product change
After conducting the interviews, I synthesized all my data points with important actionable insights, with matched design recommendations.
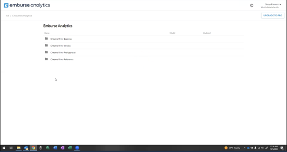
BEFORE: Emburse Analytics uses a folder structure with implicit description
Insight 1: Both type of users consider the folder structure in accessing data files logical, but only with clear naming
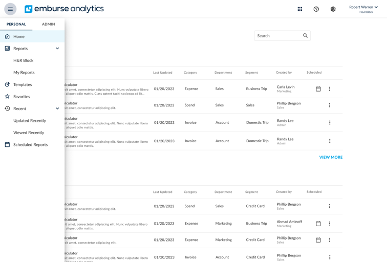
AFTER: new navigation sidebar with a better folder structure, with an extra search bar
Consider how quickly we can locate files on our own desktops, as we are the ones who name and organize them under a specific hierarchy. In contrast, data files in Emburse Analytics are organized by default settings, making it difficult for users to find specific files. As the number of users managing folders and files grows, this challenge becomes more prominent.
Recommendation 1: Maintain the folder structure but change it to expanded sidebar for better navigation
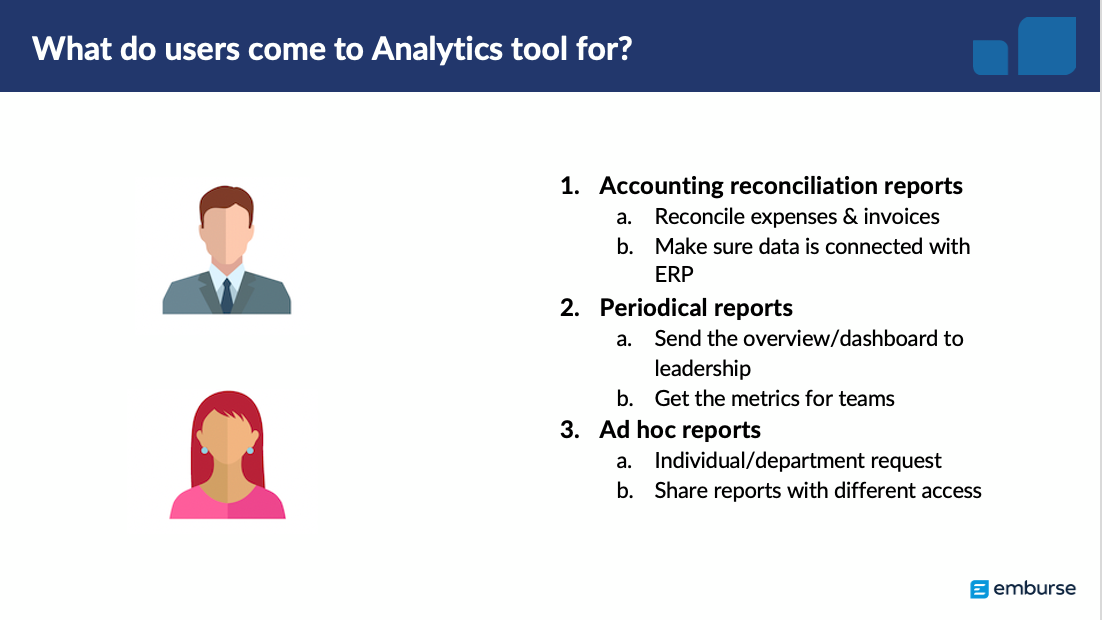
Insight 2: Pro-tier users come to Emburse Analytics for financial insights by creating various types of reports, including accounting reports, periodic reports, and ad hoc reports
Insight 3: Pro-tier users prefer to find an existing template and change the parameters, when it comes to build analytics reports
Combining Insight 2 & Insight 3, we learned about the motivation of using analytics tool. In order to better serve our users and provide them with a better user experience, we re-designed our dashboard and wished to prioritize the report creation feature for them.
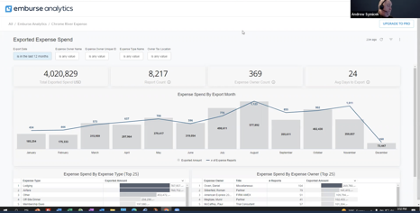
Before: data dashboard was the starting point for users, where we found out that the intention was unclear to users
Recommendation 2: Prioritize report creation feature in the home page, with saved templates and recent-built reports
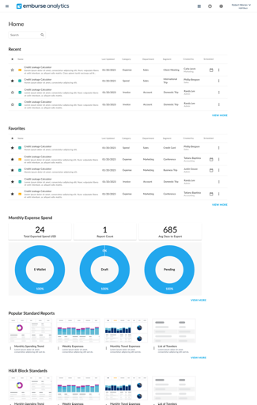
AFTER: new dashboard prioritizing recent-opened reports & saved templates, deprioritize visualizations
Reassuring the information architecture through participatory workshop
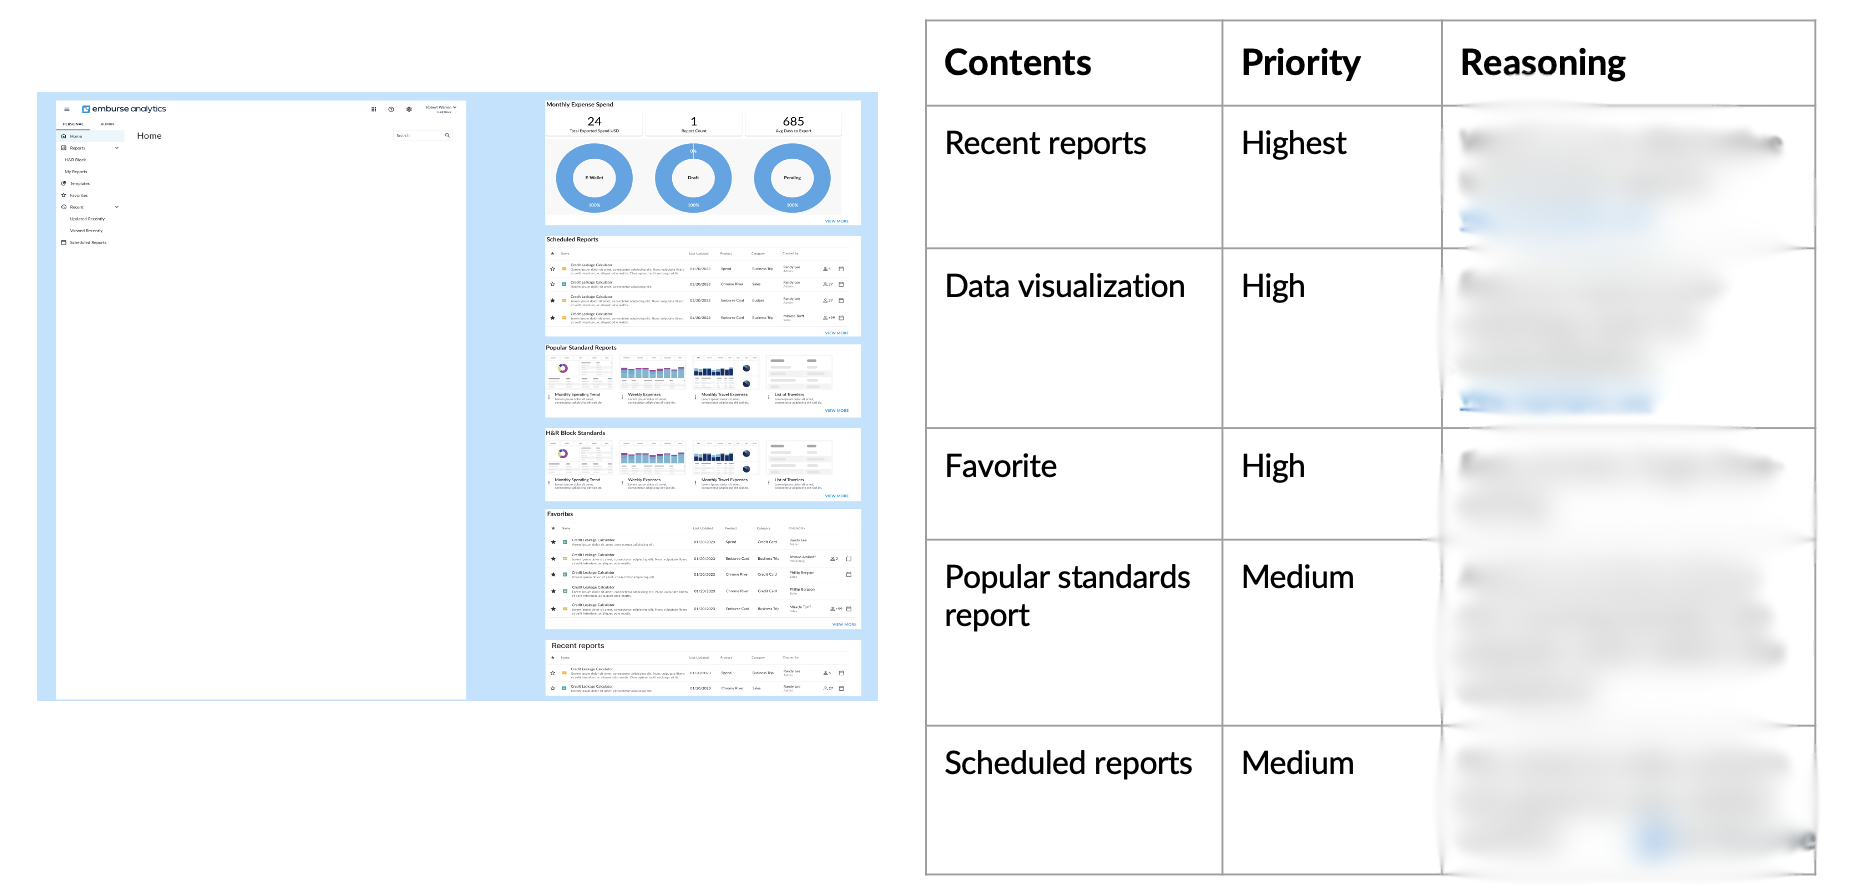
Users were asked to drag important components from the right to the empty home page on the left to build their own dashboards
Due to the extensive redesign of the home page, we want to conduct another round of testing to confirm users’ priorities. Previous insights indicated that users prioritize the report creation feature, but several folders offer similar functions for quick access to report creation. Therefore, the priority of these individual folders remains unclear. To address this, I proposed using a participatory workshop combined with a think-aloud method, where users design their own dashboards and provide detailed reasoning for their choices.
Organizational Impacts
Got involved in the product roadmap meetings
Designed client panel list for Analytics product & documented b2b client recruitment process